.svg)

Written by: Cristian O.
October 10, 2025
Despite being the global leader economically, technologically, and militarily, Americans do not get to live in a country that is the leader in safety. Americans know crime is a problem but how much of a problem is it?
We set out to investigate how crime in America compares to that of other peer high-income countries but also to that of low-income countries that are infamous for their crime levels. Additionally, we set out to compare the crime levels amongst the largest cities in America (and some notable medium-sized ones) and sought to see if political affiliation of the city had any correlation with crime levels.
Crime can occur in several different ways: robbery, sexual assault, pickpocketting, murder, etc. This study focuses on measuring crime in terms of homicides as a homicide is the type of crime that is least likely to go unreported and therefore results in the most reliable metric for comparison. Additionally, one could argue that murder is the ultimate type of crime that could be done to a person. We use the metric of homicides per capita (100,000 people) to account for any difference in population sizes between locations. We also selected countries that have large populations (in the many millions) so there was better statistical significance in the homicide per capita number.
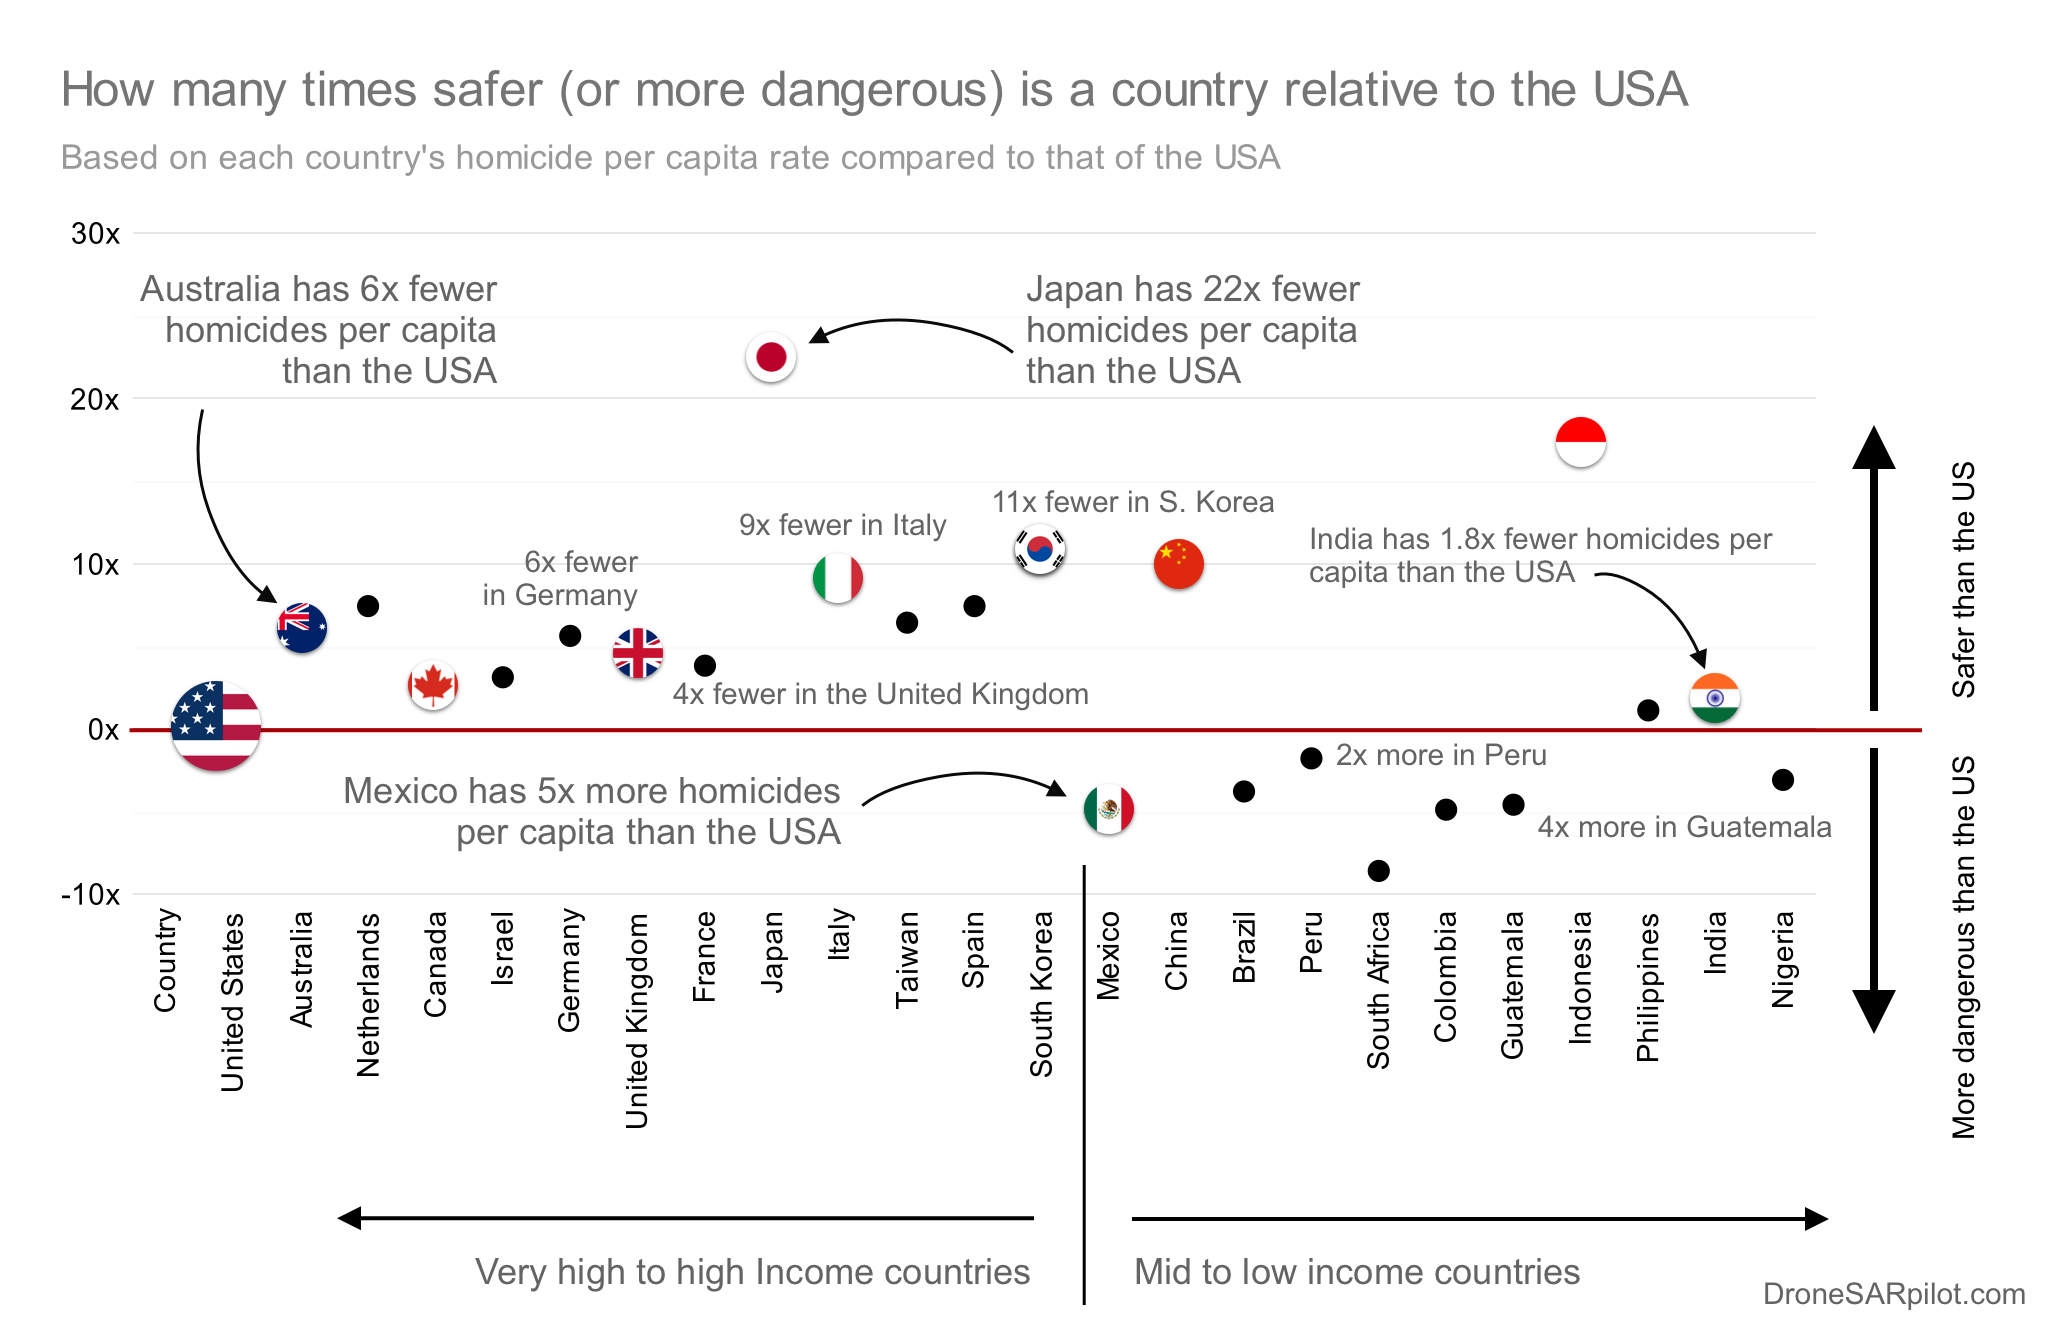
The United States nationwide average is 5.6 homicides per 100,000 people [2]. This average includes every large city, every suburb, and every rural area of the country. If we compare that number to that of other countries, we start to realize that US crime levels are low tier for a high tier country. Out of the 42 developed nations in the world, only one country (the United States) has a homicide per capita higher than 5 homicides per 100,000 people [1]. The next highest homicide per capita in the developed world is by Lithuania with 2.6 which makes it twice lower than that of the US.
Lithuania with its population of just 2.9 million isn’t too well known of a country. What about other large, developed countries?
The numbers aren’t any better. Countries that are culturally similar to the USA such Australia, Netherlands, Canada, Germany, and United Kingdom have rates of:
The difference in crime becomes even more dramatic once you look into Asian countries.
Any American who’s visited any of these 3 countries will anecdotally tell you that their safety does feel like a breath of fresh air. You don’t have to worry about avoiding certain streets or certain streets are ok as long as there’s daylight or being on certain streets is ok at night but keep your eyes open, none of that.
Your mind is at total peace and there’re no “street smart” rules to beware about. It is refreshing. I include myself after my visit to Japan and Taiwan, which is what inspired me to research this topic.
Perhaps one could try to rebuttal the data and say, well, those countries are safer than us but we are still safe. We feel safe until we or someone that we know is a victim of crime.
US crime levels are closer to that of Mexico, Colombia, and Brazil than to that of its peer developed nations. Mexico, Colombia, and Brazil are full of good people, but it’s no secret that crime is part of those countries’ reputations and their locals will not deny that crime is a primary problem for their livelihood. People in Latin American countries will often blame crime on the lack of economic opportunities in their countries, but the US GDP per capita is many times higher than theirs with crime levels not too far from theirs.
The point of this analysis is that the US, being the global leader, should have crime levels similar to that of other developed nations and not to that of countries that are still trying to develop their economies.
The US homicide per capita rate shouldn’t even just be around the same as other developed countries. It should be much better. The expectation is for the US to be the best and not just average or worse, below average.
If America has been a global leader in other aspects, why can’t it be a global leader in this? And why do some people try to downplay it?
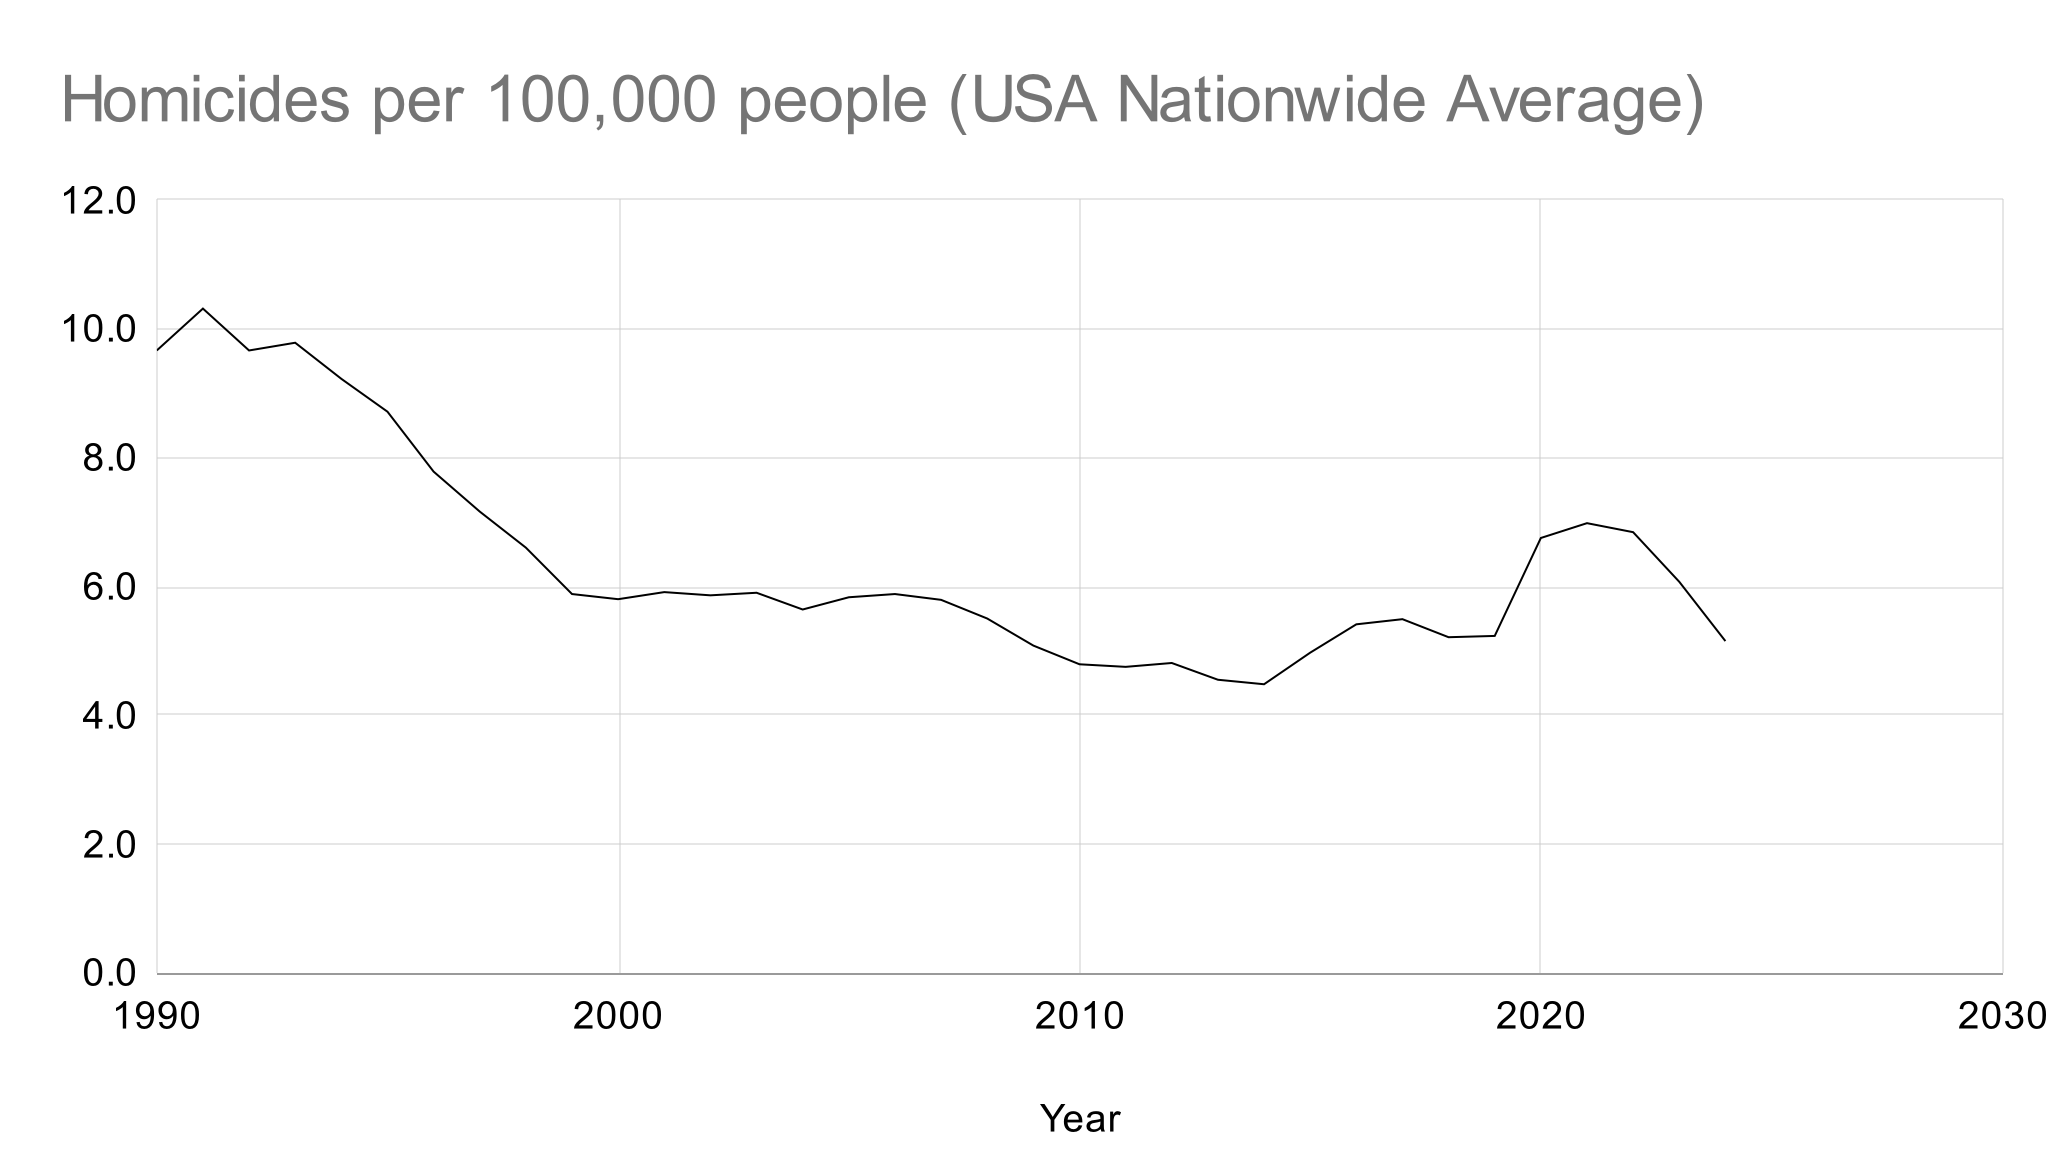
Data from the FBI [2] shows a noticeable decrease in homicides from the 1990, but it has then mostly plateaued for the past 25 years. Since 1990, nine presidential terms have been started with six different presidents.

We then wanted to see what crime looks like in the largest cities (metropolitan counties) [3] in the country. To this list, we also added some medium-sized cities that are worth looking at such as Colorado Springs, Birmingham, Baltimore, Wichita, New Orleans, St. Louis, and Richmond.
We then classified a city as a Democrat city or a Republican city based on what its corresponding county voted for during the 2024 US presidential election.
Cities such as Memphis and St. Louis have crime numbers that nearly quadruple the nation’s average and double the average of the Latin American countries with most homicides.
A claim that we’ve heard in the media and by politicians is that cities voting for Democrats have more crime than cities that vote for the Republican political party and these cities are like this because of the democrats. So, we looked farther into this.
The only pattern that appears to exist is that the larger the city (or metropolitan county), the more likely it is to vote democrat while rural communities are more likely to vote republican and that’s about it. There’s no further strong pattern in our opinion.
A handful of large cities’ counties still voted republican such as those pertaining to Fort Worth (TX), Phoenix (AZ), Tampa (FL), Miami (FL), Jacksonville (FL), Oklahoma City (OK), and Tulsa (OK). Homicides per capita in those cities are above the national average, which is already a high number as it is. Many Democrat cities were also above the national average but at the same time, many other Democrat cities were also below it such as San Diego, El Paso, San Jose, and Boston.
Republican cities are sometimes better and sometimes worse than Democrat-run cities. We don’t think there’s a strong pattern in crime vs. political affiliation of a city.
Please note that these homicide rate numbers are for the year 2023. The Center for Disease Control and Prevention (CDC) has not posted the murder rates for the year 2024 as of Oct 10, 2025. We prefer CDC data as it collects data from death certificates submitted by coroners or medical examiners. Alternatively, homicide data is also reported by city police departments and by county sheriff departments. The problem with using this data source is that many times the data is not published by all the different police departments present in a county. A county can have many different cities in it with several different police departments and not all of them will publish their data online, resulting in partial data.
There are many possible approaches to tackling crime with their corresponding pros, cons, and effectiveness. Our goal is not to dive into all the different ways crime could be tackled. Since we are a drone-related website, we’d like to focus on a drone-related approach. One approach that could potentially work in conjunction with other campaigns.
The idea is to prevent father crime from happening, not just punishing after the crime has already happened. Drones could work in the following way
Increase police patrol presence
Fear of police presence nearby can be a deterrent for criminals to commit a crime. Drones could be used to add further patrol to the streets.
If you work in law enforcement and wish to fly a drone for your job, you must get your Part 107 remote pilot license with the FAA. We provide free Part 107 practice tests to help you study for the test.
